centralized logging with loki
I have a lot of hosts to manage, from VMs to LXC containers to remote servers. When something goes wrong, it’s tedious to figure out what went wrong on which one of the servers. It’s just not feasible and requires a lot of manual debugging everytime.
I had a basic setup of some bash scripts which would manage syslog of every host but I wanted to make it a bit organized. Therefore, I looked at different options and naturally stumbled upon the most popular log stack which is loki, promtail, grafana.
The most important thing was to find the most lightweight log stack and also host it natively in an alpine LXC container which will take minimal resources.
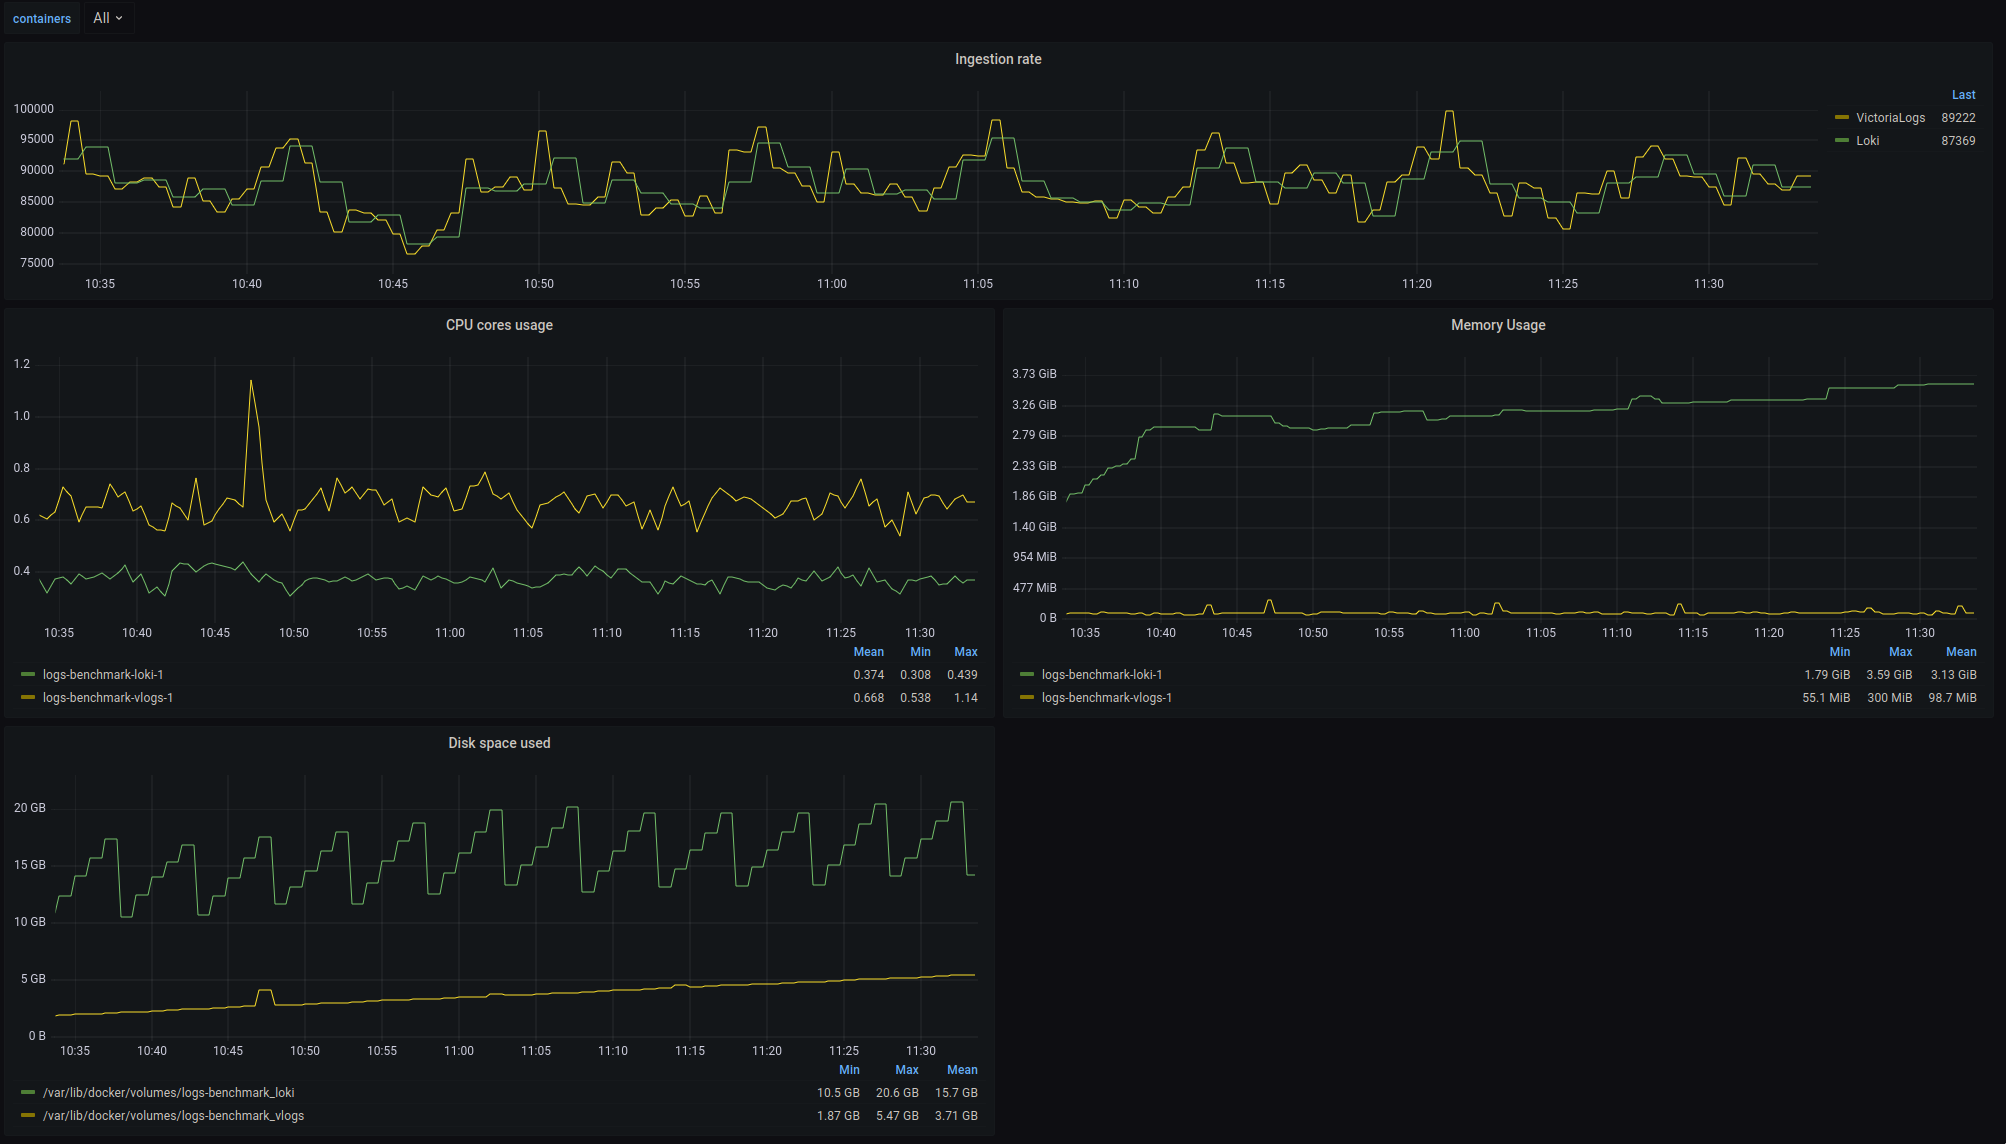
loki and promtail are definitely lightweight but not much in comparison to VictoriaLogs. The below benchmarks, taken from VictoriaLogs github repository, shows that loki takes way more RAM than VL:
setup
We won’t be using docker or any other “orchestrator” for this one. We will run everything on alpine LXC container, which you can create on proxmox.
Luckily, alpine’s community repository includes the latest builds for loki, promtail and grafana so we will use that.
I have allocated 2vCPU, 2GiB RAM and 40GiB for disk space. We will run some benchmarks later on to see if we can smoothly run with this much resources or not.
Let’s install ssh and enable it:
apk add openssh
service sshd start
rc-update add sshd
We will also install supervisord, which you can think of as a lightweight systemd (without being privileged ofcourse) for running daemon processes, which we are gonna do.
apk add supervisor
configuration
Vector is an optional program, which we aren’t gonna use for this post.
Install loki, grafana and promtail:
apk add loki promtail-loki grafana
Alright, let’s start with the basic loki config:
auth_enabled: false

server:
  http_listen_port: 3100

# Configuration for common settings across Loki components
common:
  # Prefix for paths used by Loki, useful for running multiple instances
  path_prefix: /loki

  # Storage configuration for Loki
  storage:
    filesystem:
      # Directory where chunk data is stored
      chunks_directory: /loki/chunks
      # Directory where rule data is stored
      rules_directory: /loki/rules

  # Number of replicas for each log stream
  replication_factor: 1

  # Ring configuration for Loki's distributed hash table
  ring:
    kvstore:
      # Store type for the ring's key-value store
      store: inmemory

# Cache configuration to improve performance
cache_config:
  # Enable caching for the index
  index_cache:
    enable: true
    max_size_mb: 1024  # Maximum size of the cache in megabytes
    validity: 1h       # How long to keep cache entries before expiring them

  # Enable caching for chunks
  chunk_cache:
    enable: true
    max_size_mb: 1024  # Maximum size of the cache in megabytes
    validity: 1h       # How long to keep cache entries before expiring them

# Schema configuration for Loki's data storage
schema_config:
  configs:
    - from: 2024-10-24  # Date from which this schema configuration is valid
      store: tsdb       # Storage type for the schema
      object_store: filesystem  # Object store type for the schema
      schema: v13       # Schema version
      index:
        prefix: index_  # Prefix for index files
        period: 24h     # Time period for index files
We are gonna use inmemory store for faster transactions and keep caching for 1h. It will run on port 3100.
Now, we can write the promtail config (replace ansible_hostname with your hostname if you don’t plan on using the playbook). For now, we are gonna focus on getting syslog only:
server:
  http_listen_address: 0.0.0.0
  http_listen_port: 9080
  grpc_listen_port: 9096

positions:
  filename: /tmp/positions.yaml

clients:
  - url: http://<loki-ip-or-hostname>:3100/loki/api/v1/push

scrape_configs:
  - job_name: system
    static_configs:
      - targets:
          - localhost
        labels:
          instance:
          __path__: /var/log/*
There is a job named system in scrape_configs. We specified the path from which to parse the logs using __path__ and gave a name to it (instance label).
Replace the appropriate hostname or IP for loki.
For systemd distros, you will need to use journal module to scrape logs:
server:
  http_listen_address: 0.0.0.0
  http_listen_port: 9080
  grpc_listen_port: 9096

positions:
  filename: /tmp/positions.yaml

clients:
  - url: http://192.168.31.55:3100/loki/api/v1/push

scrape_configs:
  - job_name: systemd-journal
    journal:
      path: /var/log/journal
      max_age: 12h
      labels:
        instance:
    relabel_configs:
      - source_labels: ['__journal__systemd_unit']
        target_label: 'unit'
      - source_labels: ['__journal__hostname']
        target_label: 'hostname'
For installing promtail on different hosts, you can use the following playbook where the labels are replaced with the ansible_hostname value in your inventory file:
---
- name: Install and configure Promtail
  hosts: all
  become: yes
  tasks:
    - name: Download Promtail
      get_url:
        url: https://github.com/grafana/loki/releases/download/v3.4.2/promtail-linux-amd64.zip
        dest: /tmp/promtail-linux-amd64.zip

    - name: Install unzip
      apt:
        name: unzip
        state: present
      when: ansible_os_family == 'Debian'

    - name: Extract Promtail
      unarchive:
        src: /tmp/promtail-linux-amd64.zip
        dest: /usr/local/bin
        remote_src: yes

    - name: Remove zip file
      file:
        path: /tmp/promtail-linux-amd64.zip
        state: absent

    - name: Rename Promtail binary
      command: mv /usr/local/bin/promtail-linux-amd64 /usr/local/bin/promtail

    - name: Ensure /usr/local/bin is in PATH
      lineinfile:
        path: /etc/environment
        state: present
        regexp: '^PATH='
        line: 'PATH="/usr/local/sbin:/usr/local/bin:/usr/sbin:/usr/bin:/sbin:/bin"'

    - name: Source /etc/environment
      shell: source /etc/environment
      args:
        executable: /bin/bash

    - name: Create Promtail config directory
      file:
        path: /etc/promtail
        state: directory
        owner: root
        group: root
        mode: '0755'

    - name: Check if systemd is present
      command: cat /proc/1/comm
      register: init_system
      changed_when: false
      ignore_errors: true

    - name: Set fact for systemd presence
      set_fact:
        is_systemd: "systemd"

    - name: Copy Promtail config for systemd
      template:
        src: ./promtail/systemd.yaml.j2
        dest: /etc/promtail/promtail-config.yaml
        owner: root
        group: root
        mode: '0644'
      when: is_systemd

    - name: Copy Promtail config for non-systemd systems
      template:
        src: ./promtail/syslog.yaml.j2
        dest: /etc/promtail/promtail-config.yaml
        owner: root
        group: root
        mode: '0644'
      when: not is_systemd
You can tweak it a little for non-debian distros accordingly.
Now let’s configure supervisord on the alpine container. The default config is at /etc/supervisord. If you’d like to read it, then go ahead otherwise you can paste the following config:
[unix_http_server]
file=/run/supervisord.sock  ; the path to the socket file
;chmod=0700                 ; socket file mode (default 0700)
;chown=nobody:nogroup       ; socket file uid:gid owner
username=user
password=super-secret-password

[supervisord]
logfile=/var/log/supervisord.log ; main log file; default $CWD/supervisord.log

[rpcinterface:supervisor]
supervisor.rpcinterface_factory = supervisor.rpcinterface:make_main_rpcinterface

[supervisorctl]
serverurl=unix:///run/supervisord.sock
;serverurl=http://127.0.0.1:9001
username=user
password=same-password-from-unix-http-server

[program:grafana]
command=grafana-server --homepath "/usr/share/grafana" --config="/root/logs/grafana/config.yaml"
autostart=true
autorestart=true
stderr_logfile=/var/log/grafana.err.log
stdout_logfile=/var/log/grafana.out.log

[program:loki]
command=loki --config.file="/root/logs/loki/config.yaml"
autostart=true
autorestart=true
stderr_logfile=/var/log/loki.err.log
stdout_logfile=/var/log/loki.out.log

[program:promtail]
command=promtail -config.file="/root/logs/promtail/syslog.yaml"
autostart=true
autorestart=true
stderr_logfile=/var/log/promtail.err.log
stdout_logfile=/var/log/promtail.out.log

[include]
files = /etc/supervisor.d/*.ini
Most of it is self-explanatory. The programs that we are gonna run also have a very simple configuration.
We specify the name after program: and then the command to run as a daemon process.
Enable and start supervisord on boot:
rc-update add supervisord
service supervisord start
Running rc-status will give you the details on which programs run at boot:
logs:~# rc-status
Runlevel: default
 supervisord       [  started  ]
 crond             [  started  ]
 sshd              [  started  ]
 networking        [  started  ]
Dynamic Runlevel: hotplugged
Dynamic Runlevel: needed/wanted
 localmount        [  started  ]
Dynamic Runlevel: manual
Sweat. Now start the service:
service supervisord start
If you get the following logs, indicating RUNNING state, your processes have started just fine:
2025-03-05 04:57:03,210 CRIT Supervisor is running as root.  Privileges were not dropped because no user is specified in the config file.  If you intend to run as root, you can set user=root in the config file to avoid this message.
2025-03-05 04:57:03,220 WARN No file matches via include "/etc/supervisor.d/*.ini"
2025-03-05 04:57:03,233 INFO RPC interface 'supervisor' initialized
2025-03-05 04:57:03,233 INFO supervisord started with pid 519
2025-03-05 04:57:04,243 INFO spawned: 'grafana' with pid 529
2025-03-05 04:57:04,264 INFO spawned: 'loki' with pid 530
2025-03-05 04:57:04,265 INFO spawned: 'promtail' with pid 531
2025-03-05 04:57:05,266 INFO success: grafana entered RUNNING state, process has stayed up for > than 1 seconds (startsecs)
2025-03-05 04:57:05,266 INFO success: loki entered RUNNING state, process has stayed up for > than 1 seconds (startsecs)
2025-03-05 04:57:05,266 INFO success: promtail entered RUNNING state, process has stayed up for > than 1 seconds (startsecs)
If there is an exit, restart or anything like that, you might wanna take a look at the respective process’s error logs which we specified in the program field on supervisord config.
Grafana runs on port 3000. Let’s use the following simple dashboard which gives you a nice little dropdown for choosing the instance label:
{
  "uid": "loki-dashboard",
  "title": "Loki Dashboard",
  "rows": [
    {
      "title": "Logs",
      "panels": [
        {
          "id": 1,
          "title": "Logs",
          "type": "logs",
          "datasource": "loki",
          "targets": [
            {
              "expr": "{instance=\"$instance\"}",
              "legendFormat": "",
              "refId": "A"
            }
          ],
          "options": {
            "showLabels": true,
            "scrollToBottom": true
          },
          "gridPos": {
            "h": 20,
            "w": 24,
            "x": 0,
            "y": 0
          }
        }
      ]
    }
  ],
  "templating": {
    "list": [
      {
        "name": "instance",
        "query": "label_values(instance)",
        "multi": false,
        "includeAll": true
      }
    ]
  }
}
Now, you can run the promtail playbook to install the agents on other hosts.
ansible-playbook -i inventory logs.yaml